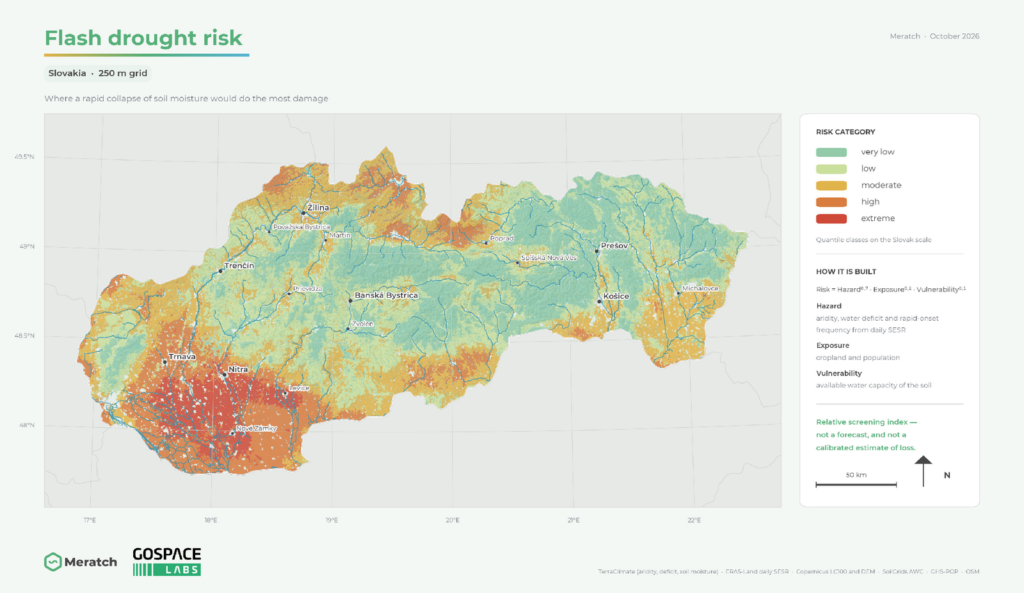
Drought in our part of Europe used to arrive slowly. It announced itself over a season, and that gave us time — to revise a sowing plan, to move water, to issue a restriction before anyone had to send a tanker. That drought still exists. Next to it, though, there is now a second kind, and it does not give us the time: soil moisture sitting near its long-term normal in early May can fall below the tenth percentile by the middle of June. It is called flash drought, and it is defined by how fast it intensifies — not, as the name suggests, by how briefly it lasts.
The case that turned this from a question of terminology into an operational problem came from the United States. The central Great Plains went through the winter and early spring of 2012 with near-normal precipitation; drought then developed suddenly in May, and by late summer the deficits were the most severe since at least 1895 — worse than the Dust Bowl summers of 1934 and 1936. The seasonal forecasts in use at the time did not predict it. We have had our own versions since, and this year we came through the driest start to a year in sixty-five years. For most of the people who had to act on it, the signal arrived as a description of a state already reached.
That is not a failure of measurement. Our national products measure the state competently and they publish it. It is a failure of timing — and timing is a different problem, which is what the Meratch drought line is built for: three layers, three questions, three horizons.
A dashboard nobody can check is a dashboard nobody has to follow.
Three quantities, not one index
Why does no single index warn us in time? Because a flash drought only becomes visible when three quantities are read together — and most products publish one of them.
| Quantity | What it answers | Where it is read |
|---|---|---|
| State | How dry is it now, against the reference period? | Precipitation and water-balance indices, soil moisture percentiles |
| Rate of change | How fast is it drying, and is that pace unusual? | Pentad-to-pentad decline in soil moisture or in evaporative stress |
| Memory | How much water is still stored underneath? | Multi-month accumulation, groundwater percentiles, total water storage |
One thing runs ahead of all three: atmospheric demand. It rises before soil moisture falls, which makes a demand index the earliest part of a flash drought that can be seen at all.
Depth matters as much as the index. The top 30 cm of soil responds within weeks and carries the flash-drought signal; the 0–100 cm layer responds over a month or more and carries the drought that is already established. Those are two products with two audiences — not one product at two resolutions.
Three layers, three questions
We split the line by the question each layer answers, because those questions differ in difficulty — and deserve different claims.
1. Monitoring — where are we now?
A daily gridded state for both soil layers, expressed as percentiles against a fixed reference period rather than as raw millimetres. This is the layer that is hardest to get wrong and easiest to undersell: most users still work from periodic summaries, so a daily, consistent, percentile-based state already changes what they can do.
2. Early warning — is it turning?
The rate layer. It does not report that a cell is dry; it reports that a cell is drying unusually fast, together with the atmospheric demand driving it. This is the layer that gives flash drought its name — and the one that monitoring, however good, cannot provide.
3. Forecast — where will we be in two to four weeks?
A probability for the drought class, published together with its benchmark and its reliability. One map of one future is not a forecast; it is a guess with a legend.
These are not three versions of the same map. Each layer has its own reader: the first, anyone tracking conditions; the second, operators who still have options; the third, anyone whose own decision carries a lead time — a sowing date, a restriction order, a reservoir drawdown, an insurance reserve.
What we expect from it
Three commitments. Each of them is also a limit, and that is the point.
Skill stated against a named benchmark
A score on its own says nothing. The honest form is the one the published literature has moved to: the improvement a forecast achieves over a stated reference. We hold to three references — persistence of the current state, the climatology of transitions, and a run driven by historical weather sequences, which separates what the weather forecast contributed from what the starting state already contained. A product that cannot beat all three is not ready. One that beats them should say by how much.
Reliability before sharpness
For a rare event, a confident map is easy and a calibrated one is hard. Published probabilities have to mean what they say: when the system says 30 %, the event should follow in roughly three cases out of ten. That is read off a reliability diagram — which tells a user more than any single skill score, and which belongs next to the maps, not in an appendix.
Lead time counted from the last observation, not from today
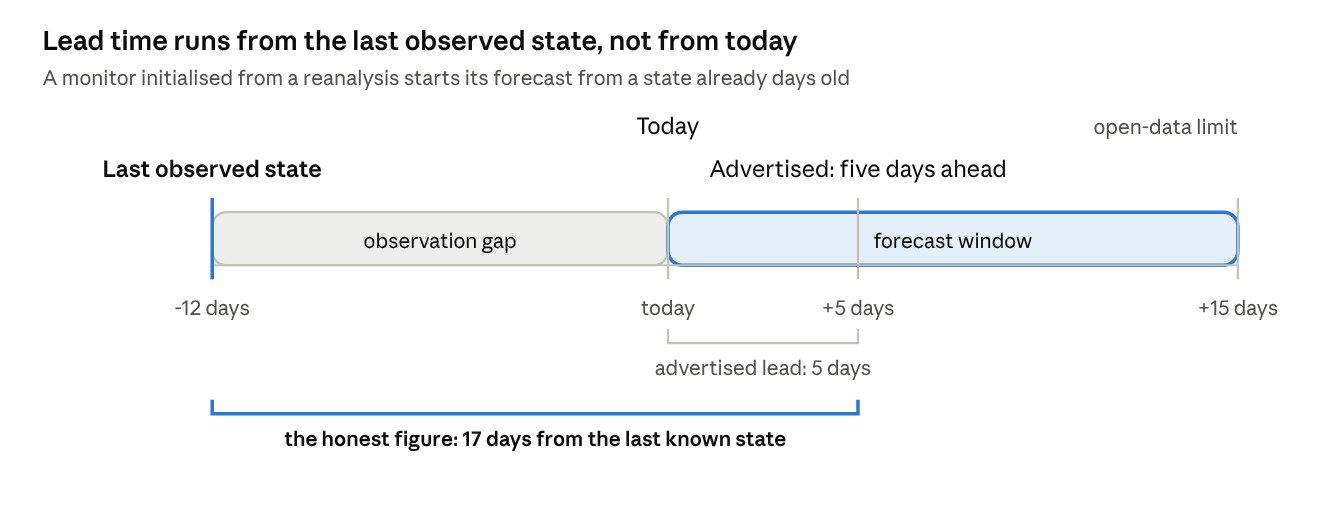
Every drought product starts from an analysis of soil moisture, and every such analysis is older than the day it is used. That gap adds to the forecast horizon one day for one day: a forecast claiming five days ahead, built on a state observed twelve days ago, is seventeen days from the last thing anyone measured. The advertised lead time and the usable one are not the same number, and the difference is not a detail.
What we do not expect: a flash drought named before the weather that causes it is predictable; useful skill much beyond four weeks; or a grid cell that stands in for a measurement in one particular field or well. A finer grid adds detail, not information. And where the three benchmarks are not beaten, we would rather publish the monitoring and say plainly that the forecast is not ready.
What it should change for Slovakia
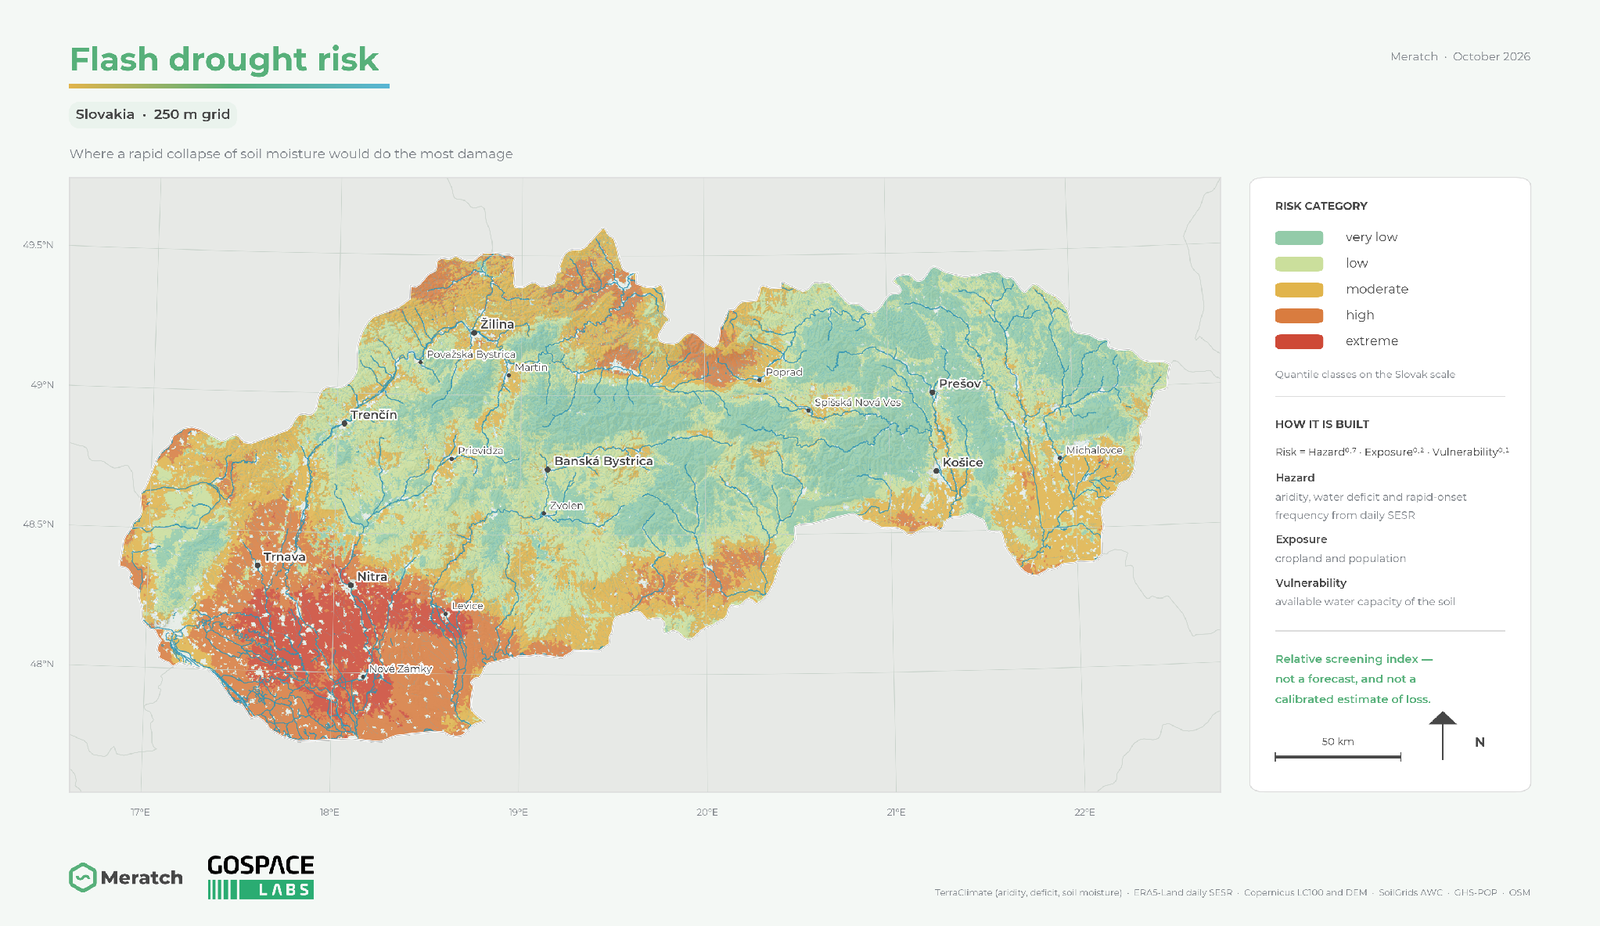
Slovakia is where the regional evidence is most specific. For Czechia, Slovakia and northern Austria, Řehoř and colleagues found the change in flash drought concentrated in April to June — the weeks when sowing, early growth and the first irrigation decisions are made, and, not by coincidence, the weeks in which those decisions can still be changed.
So what actually changes if the warning arrives two to four weeks earlier? Four decisions, at least:
- Irrigation and sowing. Both carry a lead time of their own. Moving water, or revising a sowing plan, takes days to a week. A warning that arrives together with the damage is not a warning.
- Small municipal supply. Shallow sources and small gravity systems fail quickly and recover slowly. A restriction issued early is an inconvenience; the same restriction issued late is a tanker.
- Insurance and compensation. Payouts need events dated and classified the same way every time. That is monitoring, not forecasting — and it is the layer we can improve right now.
- Water for energy and navigation. Cooling, hydropower and the Danube respond to the deeper layer. That is why we keep the 0–100 cm product separate.
Underneath all four sits the same gap. The national products report the state — how dry it is now — and report it competently. What no public Slovak product reports is the rate of intensification, or a probability for the next two to four weeks with a benchmark attached. The missing piece, in other words, is not another index.
And for Europe
The demand here is institutional, not speculative. The Commission adopted the European Water Resilience Strategy on 4 June 2025, and under security and preparedness it commits that “the Commission will enhance EU real-time early warning and monitoring systems for floods and droughts”, with “strengthened links between the European, national and local levels”. That last clause is the hard part, and it is the part a product line can actually serve.
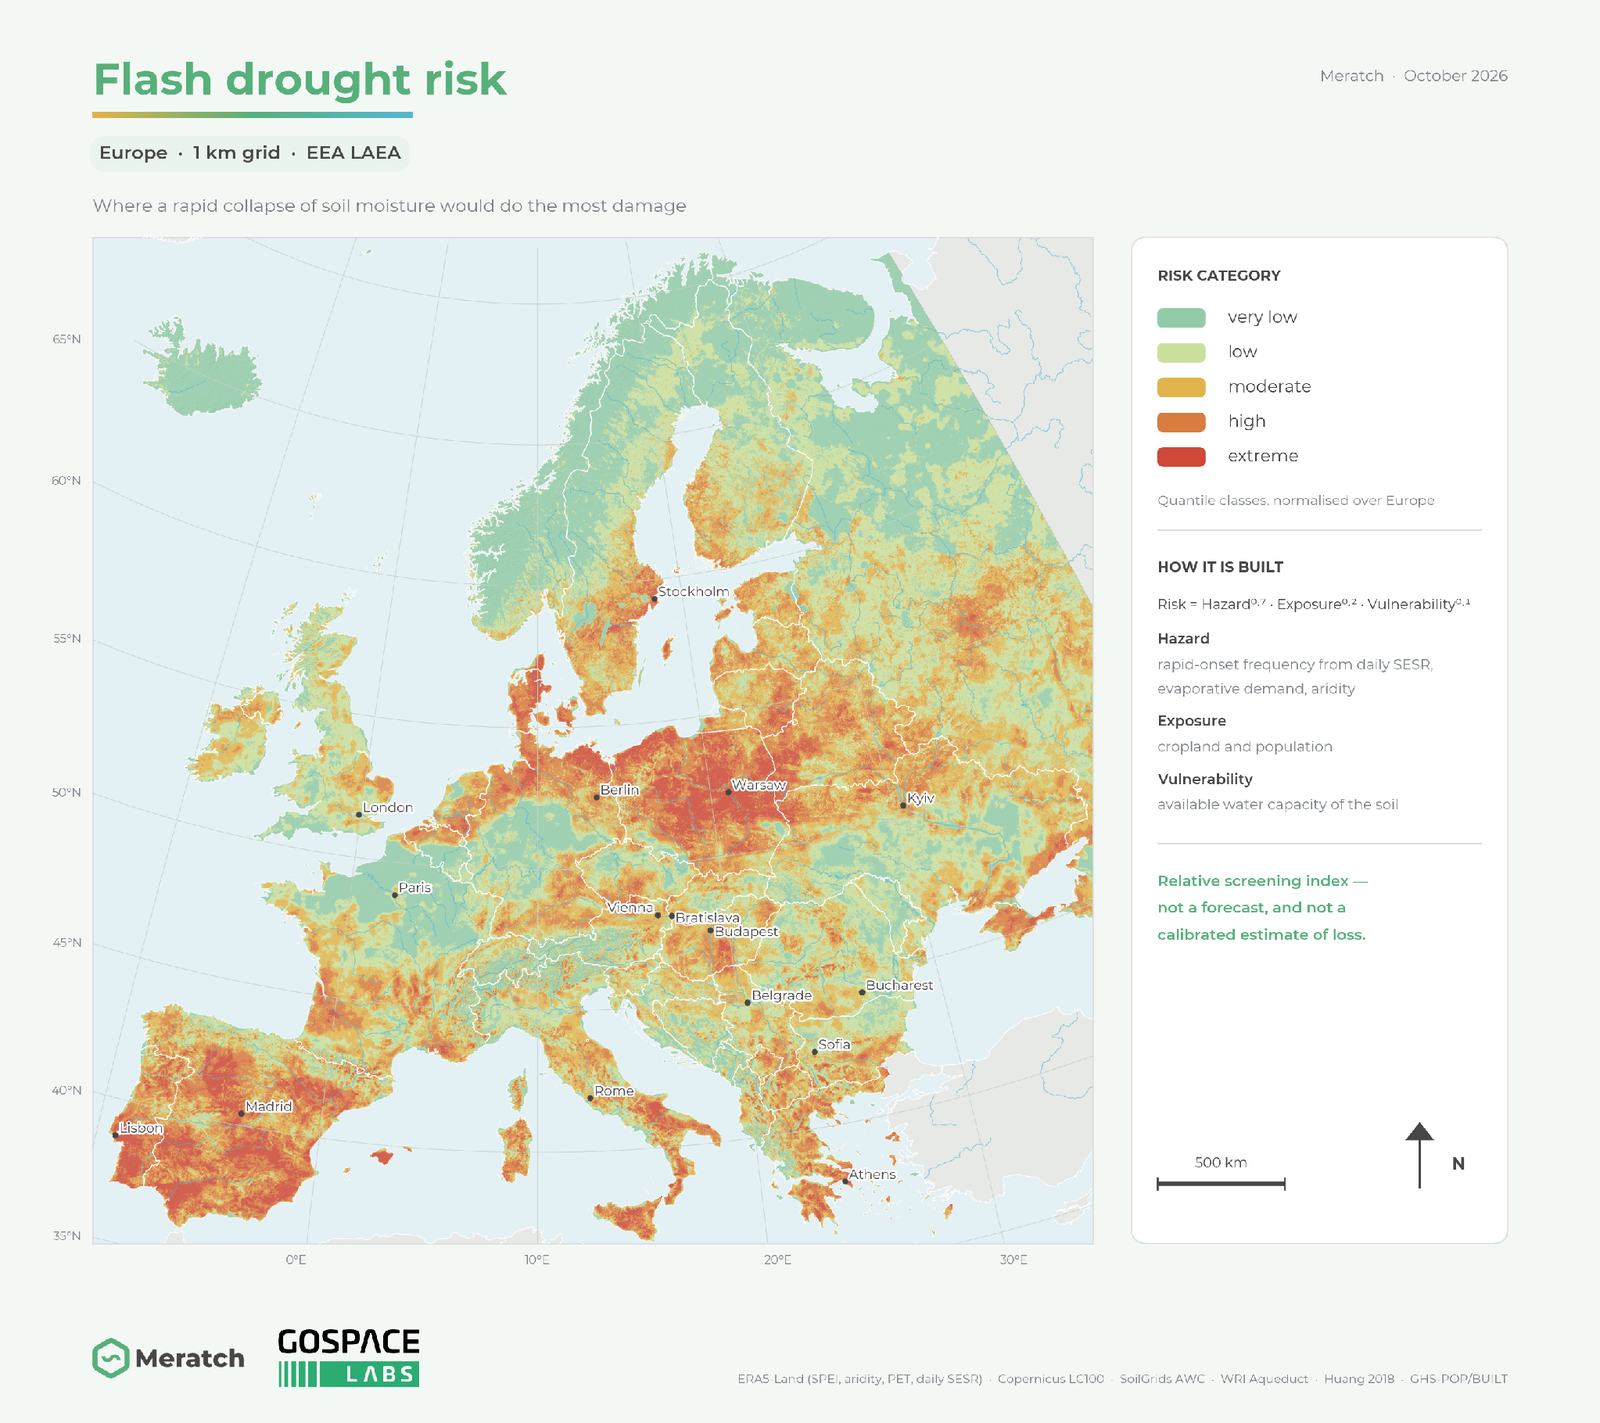
What exists at European level does the European job, and does it well. The Copernicus drought observatories give a consistent, comparable, continental picture — right for a Europe-wide overview, wrong for a 20 km² catchment, a village source or one farm’s irrigation window. The missing scale is the one in between: national down to catchment, with the rate layer included and the forecast verified.
Two things make that worth building once and sharing. Drought in Central Europe is a cross-border event — the Danube, the Tisza and the Morava carry the upstream signal to downstream users — so one method comparable across borders is worth more than three incompatible national versions. And a forecast published with its benchmark can be audited by the people who have to act on it. That is the precondition for a drought warning to carry administrative weight: a restriction, a payout, an aid request.
None of this replaces the continental services; it is built to sit between them and the decision. Whether two to four weeks of warning is enough to change what happens in a dry June, only the next dry June will tell us. One thing, though, is already clear. As long as the warning keeps arriving as a description of what has already happened, we will keep paying the difference — in yield, in tankers, in compensation. And if we learn to read the rate as well as the state, that same dry June need not cost us what the last one did.
Methodological basis
Definition and state of the science. Otkin and colleagues (2018), Bulletin of the American Meteorological Society — the review that established rapid intensification, rather than short duration, as the defining property. Lisonbee and colleagues (2021), on how inconsistently the term had been used before that. Christian and colleagues (2024), Flash drought: a state of the science review, WIREs Water 11(1). Hoerling, Eischeid, Kumar, Leung, Mariotti, Mo, Schubert and Seager (2014), Causes and predictability of the 2012 Great Plains drought, Bulletin of the American Meteorological Society 95(2), 269–282 — the case described in the opening, including the finding that the seasonal forecasts did not predict it.
Detection. Ford and Labosier (2017), soil-moisture-based identification of rapid onset. Christian and colleagues (2019), the standardised evaporative stress ratio. Osman and colleagues (2024), soil moisture volatility and a global flash drought inventory. The Evaporative Demand Drought Index, operated by the United States National Integrated Drought Information System, for the atmospheric demand side.
Trends and projections. Christian and colleagues (2021), Nature Communications, on global distribution and regional trends. Yuan and colleagues (2023), Science, on the global shift toward faster onset. Christian and colleagues (2023) on projected flash drought risk over cropland. Řehoř, Brázdil, Trnka and Balek (2024), Flash droughts in Central Europe and their circulation drivers, Climate Dynamics — the Central European analysis cited above, covering Czechia, Slovakia and northern Austria.
Forecasting and verification. Najafi, Boeing, Thober, Rakovec, Shrestha, Kelbling, Weber, Harzendorf and Samaniego (2026), High-resolution soil moisture forecasts for drought early warning in Germany, Environmental Research Letters — the benchmark practice discussed in this article. Ferro and Stephenson (2011) on the degeneration of the critical success index for rare events and the symmetric extremal dependence index proposed in its place. Shah and colleagues (2023) on onset types.
Risk layers shown here. Hazard, exposure and vulnerability combined as a hazard-dominant geometric composite on the EEA 1 km grid (EPSG:3035) and on a 250 m Slovak grid, from ERA5-Land, TerraClimate, Copernicus LC100 and DEM, SoilGrids, WRI Aqueduct, GHS-POP and GHS-BUILT. Relative screening index, not a calibrated probability of loss.
