The flood that arrives before the warning
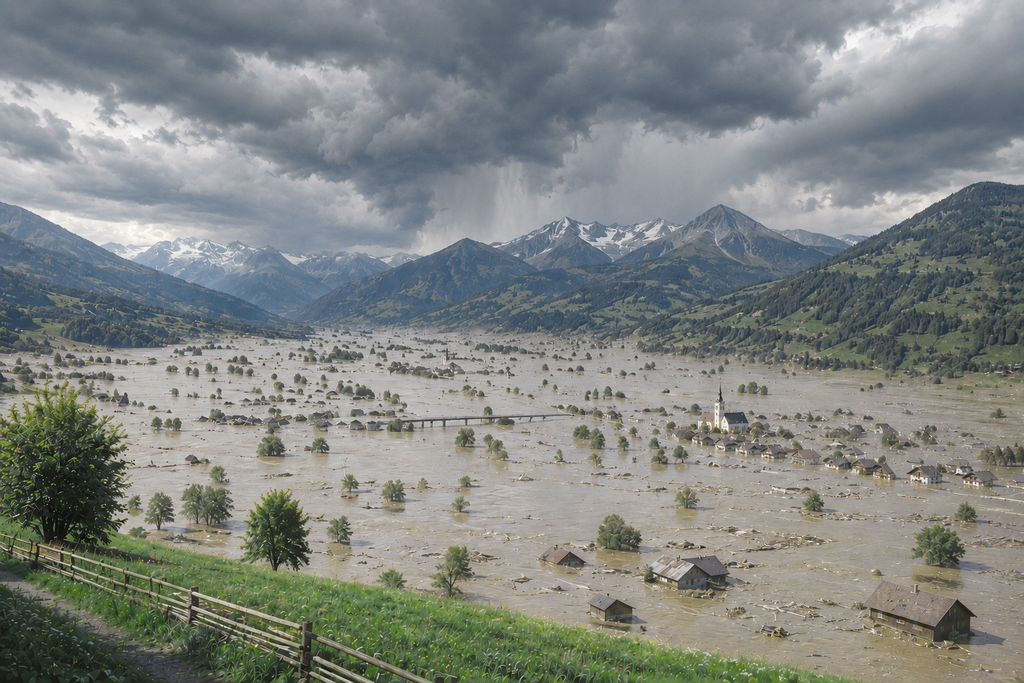
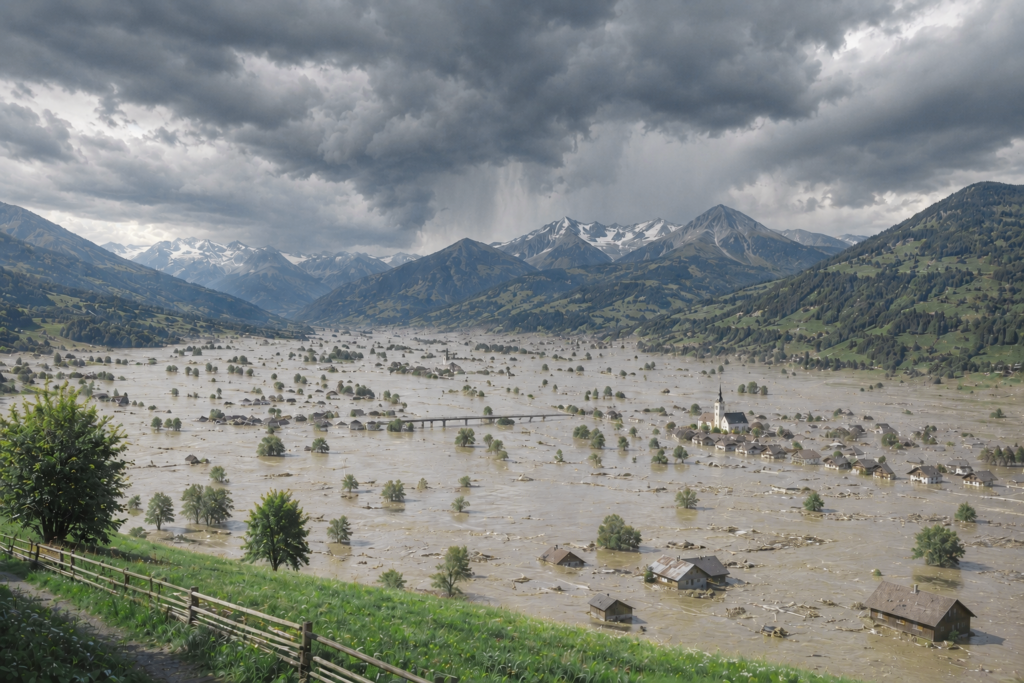
A flash flood is not a scaled-down river flood. It is a different phenomenon, with different physics and entirely different data requirements. A major Danube flood builds over days and its progress can be tracked gauge by gauge. A flash flood comes from a single convective cell over an area the size of a small town, a small catchment answers within tens of minutes to a few hours, and the whole event unfolds in less time than a conventional warning takes to be issued and distributed.
And short-duration intense rainfall is precisely what changes most in a warming climate. The review led by Hayley Fowler in Nature Reviews Earth & Environment assembled the evidence that hourly and multi-hour extremes are intensifying at least at the rate of atmospheric moisture increase — around seven per cent per degree — and in some regions faster. The reason is physically intelligible: daily totals are largely governed by large-scale circulation, whereas hourly intensity depends on convection, which responds more directly to the moisture and energy available.
The most compelling Central European evidence came last year from Klaus Haslinger and colleagues, published in Nature. The authors analysed 883 Austrian rain gauges and found that over the past four decades heavy daily totals rose by about eight per cent, but hourly extremes by as much as fifteen. More important still is what this produced in runoff: floods in small catchments increased by roughly twenty-five per cent. The authors draw a conclusion worth quoting directly — adaptation measures may be more urgent on small streams than on large rivers. Austria is the closest climatic analogue to much of Slovakia that we have in the data.
It would nevertheless be inaccurate, and ultimately counterproductive, to say that floods will simply become more frequent. Large river floods depend not only on rainfall but on antecedent soil moisture, snow storage, catchment size and shape, and season; these factors do not move in the same direction or at the same pace. A European analysis published in 2024 in Hydrology and Earth System Sciences found an increase of about eleven per cent in the spatial extent of large flood events over seventy years, attributing it in Central Europe mainly to a larger spatial extent of heavy rainfall. The signal of intensifying short-duration rainfall is therefore considerably more robust than any universal signal of increasing frequency across all flood types.
Not every kind of flood is intensifying. The kind that is happens to be the one that arrives fastest and is hardest to warn about.
Attribution studies can now quantify, for individual events, how much the conditions changed. In the catastrophic July 2021 flood in Germany’s Ahr valley, climate change increased the intensity of the one-day rainfall by three to nineteen per cent, and made such an event roughly 1.2 to nine times more likely than in a climate 1.2 degrees cooler. For storm Boris, which flooded Central Europe including Slovakia in September 2024, storyline simulations indicated about nine per cent more rainfall and an eighteen per cent larger area receiving more than one hundred millimetres. A physical attribution analysis of the October 2024 Valencia flood, published earlier this year in Nature Communications, calculated an increase of roughly twenty-one per cent in six-hour rainfall intensity and of more than fifty per cent in the area exceeding 180 millimetres.
One methodological note belongs here, and a climatologist insists on it. None of these studies claims that climate change caused the flood. They claim something different and more precise: that it changed the probability or the intensity of the conditions in which the event formed. The difference between those two sentences is the difference between science and a slogan.
Drought that develops in weeks
In hydrometeorology, drought is a term that needs qualifying every time it is used. Meteorological drought is a rainfall deficit. Agricultural or ecological drought is a deficit of water in the soil, expressed in the vegetation. Hydrological drought is a deficit in river flow and groundwater storage. These three do not evolve in parallel and need not even evolve in the same direction, which is the main reason drought is so often discussed side by side rather than jointly.
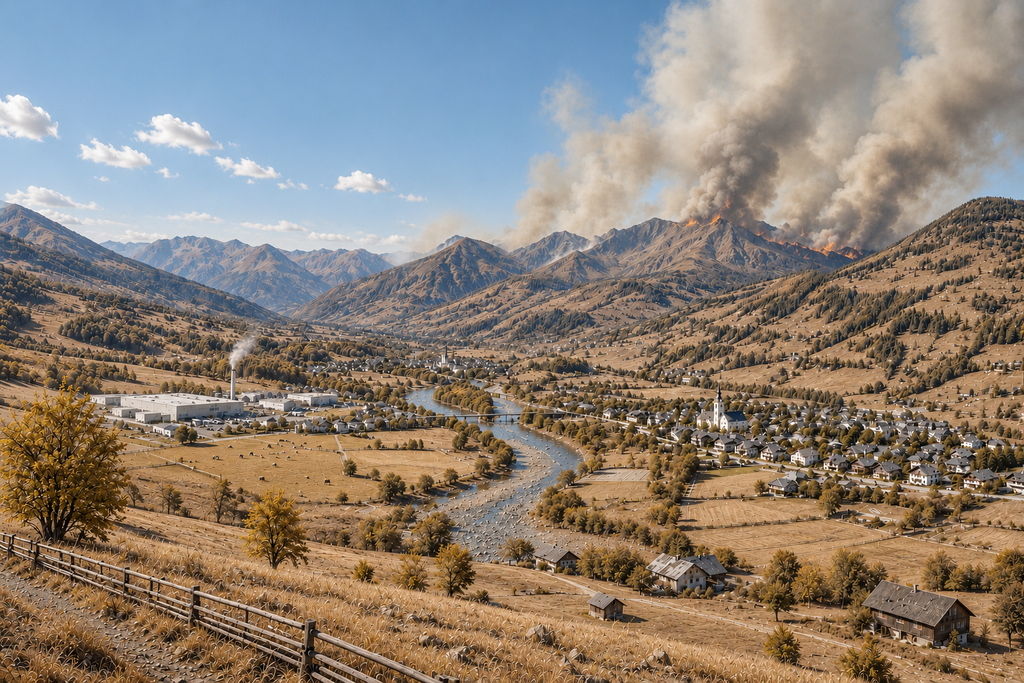
What a warming climate changes above all is how fast one turns into the next. Higher temperature and a higher vapour pressure deficit raise potential evapotranspiration — the atmosphere’s evaporative demand. The same rainfall deficit therefore produces a deeper soil drought today than it did thirty years ago, and produces it sooner. This acceleration gave rise to a category of its own, which the literature calls flash drought: an event that moves from normal conditions to severe drought within weeks rather than months.
Xing Yuan and colleagues showed in Science in 2023 that over the past sixty-four years the pace of drought onset has shifted towards flash drought across most of the regions defined by the IPCC — in seventy-four per cent of them, to be exact. The cause is a combination of amplified evapotranspiration anomalies and precipitation deficit, which the authors attribute to anthropogenic climate change. In projections, the shift expands to most land areas.
For practice this has a very concrete and uncomfortable implication. The standard rainfall indices used in operational drought monitoring — above all SPI and SPEI with a three-month accumulation window — cannot capture flash drought in principle. Not because they are computed badly, but because their accumulation window is longer than the entire event. A usable indicator has to track two things at once: the soil moisture percentile, meaning how far below the long-term climatology we are, and its rate of decline, meaning how fast we are getting there. Severity and speed are two independent axes, and collapsing them into a single number is a mistake.
A flash drought is not deeper than an ordinary one. It is faster — and speed is what decides whether there is still time to act.
Central Europe has already lived through an event that illustrates the shift. The dry period of 2018 to 2020 was, according to the analysis by Oldřich Rakovec and colleagues in Earth’s Future, unprecedented in the available European record; it covered on average 35.6 per cent of the continent and was accompanied by a temperature anomaly of 2.8 degrees above pre-industrial levels. Earlier work by Vittal Hari and colleagues dates a comparable event as unmatched in the past two hundred and fifty years. An attribution analysis of the 2022 summer soil drought concludes that in today’s climate such an event has a return period of about twenty years in western and central Europe, whereas in the pre-industrial climate it would have been a once-in-a-century event.
Nor is this only a Mediterranean concern. The European Environment Agency reports in its 2024 assessment of Europe’s water that water stress already affects around a fifth of Europe’s territory and almost a third of its population every year. The economic dimension was quantified by the European Commission’s Joint Research Centre in the PESETA IV project: total drought losses in Europe would grow from roughly 9.4 to 45 billion euros a year under three degrees of global warming.
Storms: the half hour that decides the damage
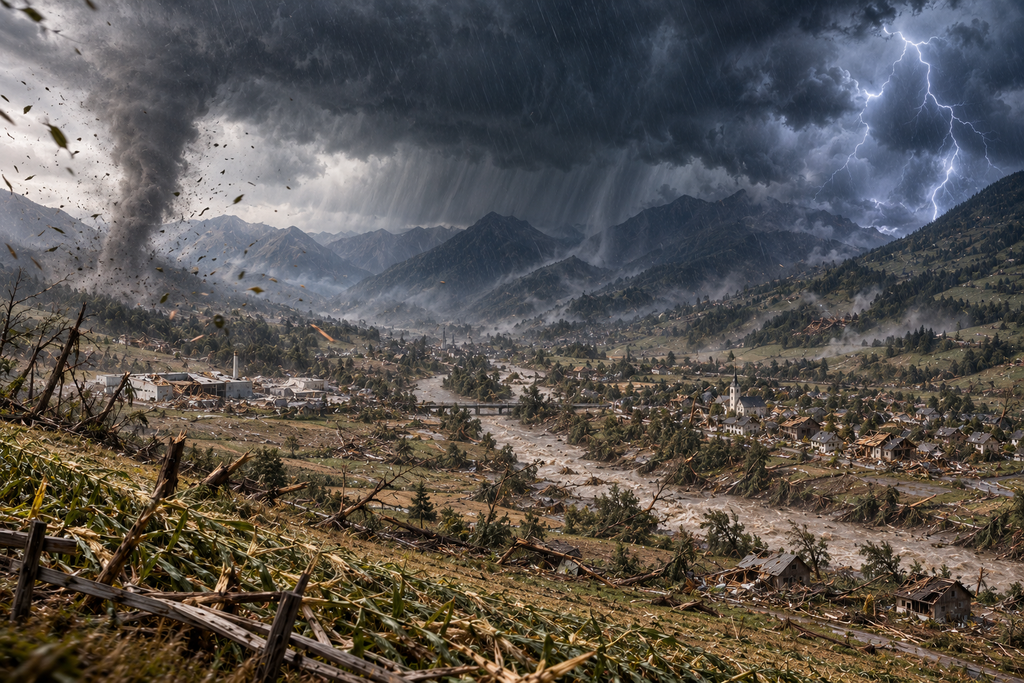
In our latitudes a thunderstorm is the hazard with the highest damage per unit of time. Hail, damaging gusts, lightning and torrential rain arrive together, over an area a few kilometres wide, within half an hour. It is also the hardest target meteorology has.
Here more caution is warranted than marketing copy usually shows. It is not scientifically defensible to claim that storms or windstorms will simply become more frequent in Central Europe. The formation and intensity of convective storms depend on a combination of conditions — available moisture, thermodynamic instability, vertical wind shear, the height of the freezing level — and these do not respond to warming in the same way. Moisture and instability are increasing; wind shear, which governs how well a storm organises, may move the other way. The IPCC therefore assesses future changes in some storm types with markedly lower confidence than changes in temperature extremes or in heavy rainfall intensity.
The most recent Europe-wide high-resolution hail study, from 2025, shows exactly this complicated picture. In some regions and seasons the potential for severe hail declines, in others it rises; over Central Europe the model even shows a decrease in the overall frequency of some hail categories, while the environment shifts towards a larger share of conditions favourable to the very largest hail. The honest formulation therefore reads: what changes is the character, the seasonality and the potential intensity of dangerous storms — not simply their number.
It is precisely this uncertainty that makes nowcasting irreplaceable. A climate model will never tell us what a particular convective cell will do on a Tuesday afternoon thirty years from now; it tells us only what environment such a cell will form in. A numerical weather model tells us whether today’s environment is favourable. But once a storm actually forms, radar decides.
Climatology tells you what environment a storm will form in. Nowcasting tells you where the one that already formed is going.
The World Meteorological Organization defines nowcasting as a detailed analysis of the current state of the atmosphere and a forecast from the present out to about six hours, focused on rapidly evolving hazardous phenomena. Its core is radar, which can observe precipitation structures at hundreds of metres of resolution and refresh every few minutes. But it has a physical limit no better algorithm can circumvent: extrapolating a precipitation field tells you very well where an existing cell will move, but it cannot create a cell that does not yet exist, nor dissipate one that is already collapsing. Error therefore grows with lead time systematically — in our own validation across dozens of independent days, the lag of the forecast field behind reality was effectively equal to the lead time itself.
European hydrometeorological studies place the highest skill of classical radar nowcasting roughly between twenty and one hundred and twenty minutes, with overall strength in the first three hours; beyond that the numerical model gains the advantage. The answer is therefore not to set the two approaches against each other but to blend them — letting radar lead the first hour and gradually handing over to the model. That nowcasting has meanwhile ceased to be mere extrapolation was shown by an evaluation of a deep-learning model which more than fifty forecasters at the UK Met Office ranked first against competing methods in 89 per cent of cases.
Water quality: the extreme that shows up later
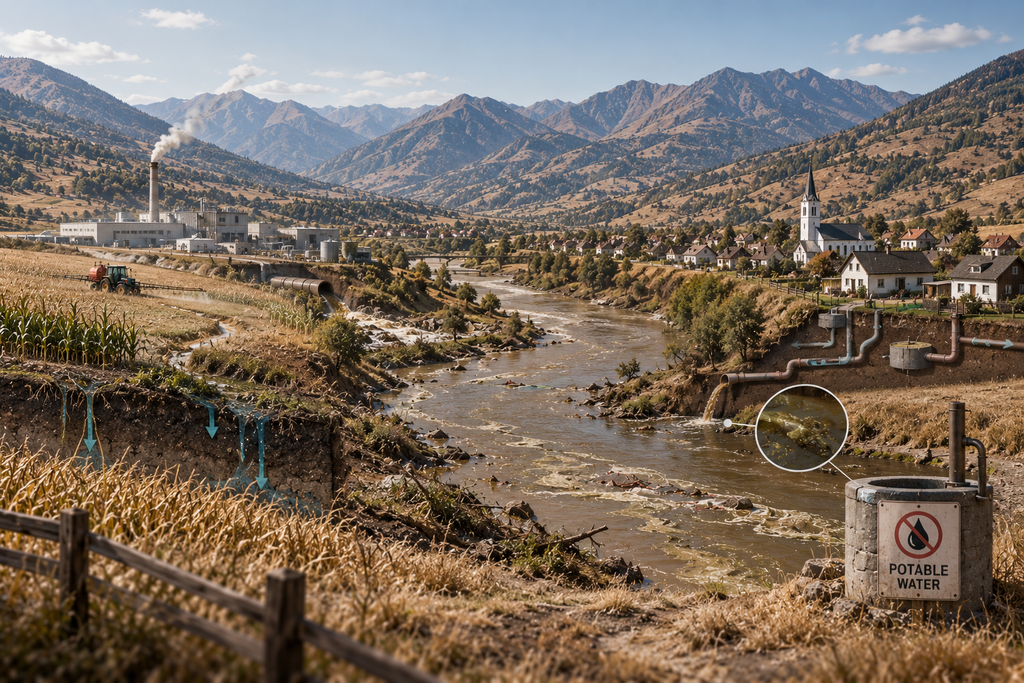
Water quality is where both ends of the hydrological swing meet — and where most monitoring systems miss them, because it does not happen on the day of the event.
The scale of that link was quantified by a large synthesis led by Michelle van Vliet, published in Nature Reviews Earth & Environment in 2023. The authors reviewed 965 case studies worldwide and found that deterioration of river water quality was recorded in 68 per cent of cases associated with drought and heatwaves, in 51 per cent of cases associated with heavy rainfall and floods, and in 56 per cent of cases assessing long-term climate change. This does not mean every extreme always degrades every parameter. It means the link between hydrometeorological extremes and water quality is the rule, not the exception.
The mechanisms operate from both sides and are almost mirror images. During a downpour, sediments, nutrients, metals and microbial load are mobilised from streets, farmland and overloaded combined sewers; combined sewer overflows are the dominant source of microbial contamination in urban rivers, and that wave reaches abstraction points hours later, once the rainfall has passed. During drought and low flows the effect reverses: the receiving water lacks the volume to dilute, so the same load produces far higher concentrations. Temperature adds to this. Warmer, slower-moving water holds less dissolved oxygen and gives a competitive advantage to toxic cyanobacteria, which favour both higher temperatures and sharper alternation between wet and dry spells.
Water quantity and water quality are not two subjects. They are one system, observed through two different variables.
The time lag is the most treacherous part. A hydrological event ends at the peak; its signature in water quality appears afterwards. Monitoring that switches off when the water recedes systematically misses precisely the part of the event that matters most for public supply.
The blind spot
Public meteorological and hydrological data are good. They are simply not close enough — and this is not a question of quality but of sampling.
A convective rain cell has a spatial scale of a few kilometres and a lifetime of tens of minutes. A standard rain-gauge network samples at tens of kilometres. In measurement terms this is a classic aliasing problem: a network cannot in principle resolve a phenomenon smaller than the spacing of its points. This is not a shortcoming of any particular network but a consequence of its geometry. The analysis of twenty-five extreme European flash floods published by Lorenzo Marchi, Marco Borga and colleagues in the Journal of Hydrology states it explicitly — even a relatively dense rain-gauge network did not have fine enough sampling characteristics to delineate the area of heavy rainfall correctly.
Radar solves the resolution problem but not the accuracy one. It measures indirectly, converting reflectivity into rainfall intensity through a relation that depends on precipitation type; beam geometry, attenuation in heavy rain and the vertical profile of reflectivity add further error. In small catchments, radar totals without gauge adjustment therefore systematically underestimate rainfall. Stream gauges, meanwhile, have historically been sited to make sense of a national water balance — that is, on larger rivers.
But a flash flood does not happen on a large river. It happens on an unnamed stream with no gauge, under a cell five kilometres wide that fits comfortably between the two nearest measuring points. In the same way, an area-wide warning cannot distinguish two points three kilometres apart, even though they may differ in rainfall total, soil moisture, slope, imperviousness and runoff response.
The blind spot is not a gap in interpretation. It is a gap in measurement — the data simply do not exist.
It can be closed by two things at once. The first is one’s own sensors where there are none: inside small catchments, on the streams and at the assets that somebody specific cares about. The second is models that recompute both public and proprietary data down to the hyperlocal level — a particular catchment, bridge, underpass or plant. This does not compete with the national meteorological service and could not; it is a further layer above it, working at a different spatial scale and answering a different question.
Two horizons, and the thing called adaptation
One question remains: why should a single company produce both a forecast for the next half hour and climate projections for thirty years. At first glance these are unrelated disciplines. In reality they are two sides of the same task, differing only in timescale.
The operational horizon — minutes to days — is where lives and property are saved. The Global Commission on Adaptation calculated that as little as twenty-four hours of warning ahead of a hazard can cut potential damage by roughly thirty per cent, and that every dollar invested in early warning systems returns on average around nine dollars in net economic benefit — the best return among all the adaptation measures assessed. With a flash flood, however, twenty-four hours is never on offer. That makes an extra few tens of minutes all the more valuable: enough to close a road, move equipment, activate a flood plan or get people away from an exposed site. This is exactly why the World Meteorological Organization speaks of early warning as a chain in which detection is only the first link; the others are forecast, an intelligible warning, communication and response. No monitoring system can therefore promise zero consequences — it can promise lead time and a better decision.
The climate horizon — years to decades — answers a different question. Not “what happens tomorrow” but “what world are we building this for”. This is where it is decided how large a culvert makes sense, where not to build at all, what capacity the sewer system needs, how much water to hold in reserve and what remains insurable. Since the assumption of stationarity has fallen, these design values can no longer be derived from historical records alone; scenarios have to be added and uncertainty handled explicitly. The first European Climate Risk Assessment, published by the European Environment Agency in 2024, identifies 36 climate risks and concludes that several have already reached critical levels and that adaptation is not keeping pace with the growth of risk. One figure from the European insurance supervisor is worth adding: of total losses from extreme events in Europe between 1980 and 2024, only about a quarter were insured. Someone else paid the rest — municipalities, the state, or people directly.
A terminological note to close, and it is not pedantry. In IPCC language, mitigation means limiting climate change itself, that is, reducing emissions and increasing greenhouse gas sinks. Adaptation means adjusting to the consequences and reducing harm. Monitoring, forecasting, risk assessment and early warning are unambiguously adaptation and resilience-building. Mitigation decides how bad the destination will be. Adaptation decides how we travel the road we are already on. Both need the same thing — numbers about the new reality, accurate enough and local enough to act on.
We cannot prevent a flood, a drought or a storm. What we can do is know sooner and more precisely where the risk arises, how fast it develops and what about it is changing. That is the whole point of this work.
Sources:
- Milly, P. C. D. a kol. (2008). Stationarity is dead: whither water management? Science 319, 573–574.
- IPCC (2021). AR6 WG1 — The Physical Science Basis, kap. 8 a 11.
- Fowler, H. J. a kol. (2021). Anthropogenic intensification of short-duration rainfall extremes. Nature Reviews Earth & Environment 2, 107–122.
- Swain, D. L. a kol. (2025). Hydroclimate volatility on a warming Earth. Nature Reviews Earth & Environment 6, 35–50.
- Copernicus C3S & WMO (2026). European State of the Climate 2025.
- SHMÚ. Človekom spôsobená zmena klímy.
- Haslinger, K. a kol. (2025). Increasing hourly heavy rainfall in Austria reflected in flood changes. Nature.
- (2024). An increase in the spatial extent of European floods over the last 70 years. HESS 28.
- World Weather Attribution (2021). Heavy rainfall which led to severe flooding in Western Europe; recenzovane: Kreienkamp a kol., Climatic Change (2023).
- Ludwig, P. a kol. (2024). How climate change intensified storm Boris’ extreme rainfall. Communications Earth & Environment 5.
- Calvo-Sancho, C. a kol. (2026). Human-induced climate change amplification on storm dynamics in Valencia’s 2024 catastrophic flash flood. Nature Communications.
- Yuan, X. a kol. (2023). A global transition to flash droughts under climate change. Science 380, 187–191.
- Rakovec, O. a kol. (2022). The 2018–2020 multi-year drought sets a new benchmark in Europe. Earth’s Future 10.
- Schumacher, D. L. a kol. (2024). Detecting the human fingerprint in the summer 2022 western–central European soil drought. Earth System Dynamics 15, 131–154.
- EEA (2024). Europe’s state of water 2024.
- Cammalleri, C. a kol. (2020). Global warming and drought impacts in the EU. JRC PESETA IV, Task 7.
- Dottori, F. a kol. (2020). Adapting to rising river flood risk in the EU under climate change. JRC PESETA IV, Task 5.
- Kahraman, A. a kol. (2025). Future changes in severe hail across Europe. Nature Communications 16.
- WMO. Nowcasting Guidelines — a summary.
- Silvestro, F. a kol. (2019). Using nowcasting technique and data assimilation in a meteorological model to improve very short range hydrological forecasts. HESS 23, 3823–3841.
- Ravuri, S. a kol. (2021). Skilful precipitation nowcasting using deep generative models of radar. Nature 597, 672–677.
- van Vliet, M. T. H. a kol. (2023). Global river water quality under climate change and hydroclimatic extremes. Nature Reviews Earth & Environment 4.
- Burnet, J.-B. a kol. (2024). Vulnerability assessment of drinking water intakes to microbial contamination during combined sewer overflows. PLOS Water 3.
- Paerl, H. W. a kol. (2023). Climate change and the aquatic continuum: a cyanobacterial comeback story. Environmental Microbiology Reports 15.
- Marchi, L., Borga, M., Preciso, E., Gaume, E. (2010). Characterisation of selected extreme flash floods in Europe and implications for flood risk management. Journal of Hydrology 394, 118–133.
- Global Commission on Adaptation (2019), Adapt Now; WMO/UN — Early Warnings for All; WMO Flash Flood Guidance System.
- EEA (2024). European Climate Risk Assessment (EUCRA).
- EIOPA. Dashboard on insurance protection gap for natural catastrophes.
