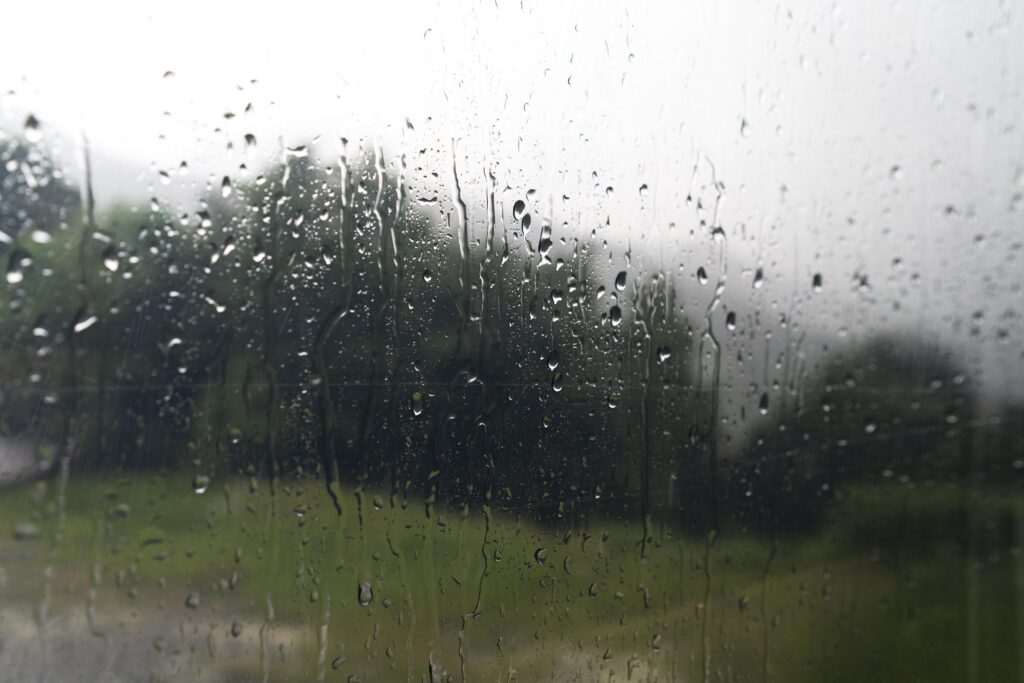
A broad band of rain crossed Slovakia on 10 and 11 September. No records fell and no flood had to be fought — which is exactly why it is worth writing about.
In less than a day Slovakia received 16 mm on average and over 50 mm in places — and it came down slowly, at 10 to 15 °C. For a parched landscape that rain is worth more than the same total from a thunderstorm: more of the water has time to infiltrate and less of it returns to the air. We also asked the long records what they say about such situations — and one of our own starting hypotheses did not survive.
The Situation
What happened on Thursday
The Carpathian region saw a weather situation it had not seen for a long time. A broad band of rain tied to a wavy cold front moved from the Adriatic across Hungary and Slovakia towards the north-east and brought long-awaited precipitation. Over a large area 10 to 40 mm fell, mostly at gentle intensity, with locally less in the east. These are not dangerous numbers, but for a landscape long troubled by drought they matter a great deal.
It also rained at a fairly low temperature of 10 to 15 °C which, together with humidity close to saturation, greatly reduced evaporation of the fallen water back into the atmosphere. Much of the water therefore had time to infiltrate instead of returning to the air or running off the surface.
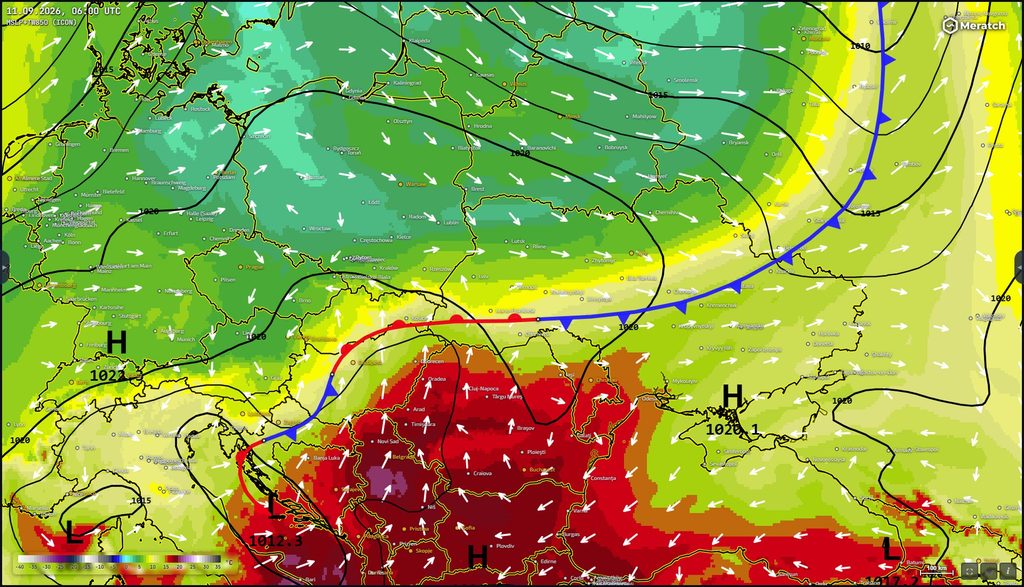
Figure 1 — Frontal analysis, 11 September 2026, 06:00 UTC. Mean sea-level pressure, temperature and wind at 850 hPa. Source: Atmoseer, ICON-EU model.
How much water actually fell? A radar field merged with measurements from 272 stations gives, for the 24 hours from 18:00 on 10 September to 18:00 on 11 September (CEST), a national mean of 15.9 mm and a highest local total of 52.9 mm in the Liptov basin. The rain covered practically the whole country, with the smallest totals in the south-east.
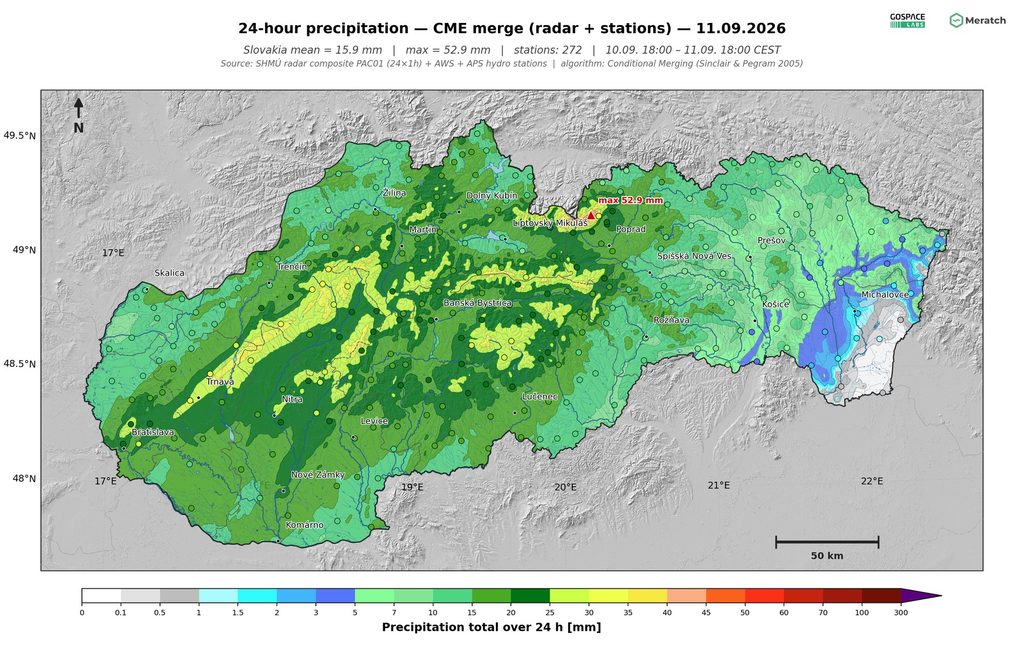
Figure 2 — Precipitation total over the 24 hours from 18:00 on 10 September to 18:00 on 11 September 2026 (CEST). A radar field merged with 272 station measurements by conditional merging — an analysis of the event, not a raw radar product.
More interesting than the total, though, is how the water arrived. One-minute observations give a median total of 11.2 mm, a median rain duration of 4.3 hours and a median instantaneous intensity of only 1.8 mm per hour. Almost nine out of ten rainy minutes stayed below 6 mm/h. Only 13.9 % of the total fell at rates of at least 10 mm/h — against 53.8 % in July and 60.2 % in August.
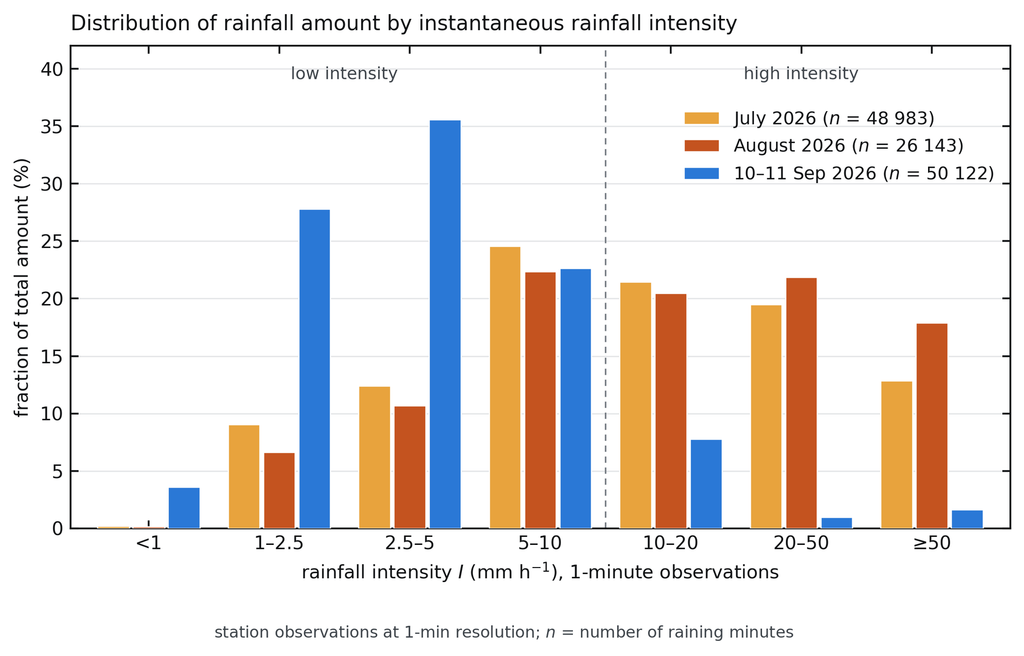
Figure 3 — Share of the rainfall total by instantaneous intensity: July 2026, August 2026 and the 10–11 September 2026 episode, from one-minute station observations. July and August are whole months, September is a single episode, so this contrasts regimes rather than showing a trend.
Thirty millimetres falling slowly all day is not the same event for a landscape as thirty millimetres from a single storm. The total can be identical. The delivery is not.
The Mechanism
Why this kind of rain is valuable
It is cold
At low temperature, under overcast skies and with humidity close to saturation, evaporation is a fraction of its summer value. That can be quantified. A balance of isolated 20–50 mm episodes over Slovakia gives, for autumn, evaporation of about 0.25 times the episode total over the following ten days, against 0.94 in summer — and conversely, autumn adds about 0.52 times the episode total to soil water storage, summer only 0.06. This is a model diagnostic (ERA5-Land) computed over the whole ten-day window including background fluxes, so it is not the fate of those particular raindrops — but the ratio between seasons is unambiguous.
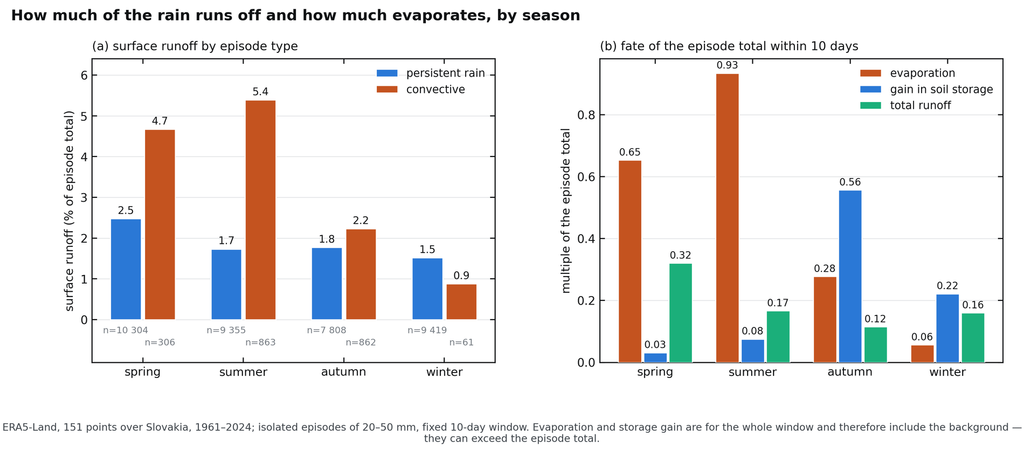
Figure 4 — What becomes of the episode total within ten days, by season: evaporation, the gain in soil water storage and total runoff (ERA5-Land, 151 points over Slovakia, isolated 20–50 mm episodes). In summer almost everything leaves by evaporation; in autumn most of it stays in the soil. The values cover the whole ten-day window including background fluxes, which is why they can exceed the episode total.
It rains slowly
Steady rain delivers water at a rate the soil can still absorb. With a downpour it is the other way round: most of the water runs off to the nearest stream before it can infiltrate — and takes the topsoil with it. The same balance shows this at equal totals: in summer 1.7 % of a steady-rain total leaves as surface runoff, against 5.4 % for a convective episode, about three times more. The gap is largest when the soil is already wet.
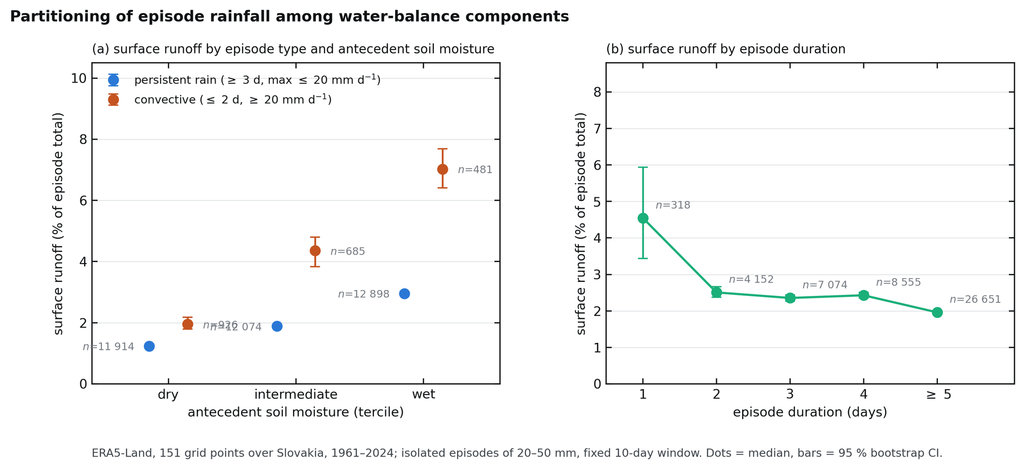
Figure 5 — Surface runoff at equal episode totals (20–50 mm) by episode type and antecedent soil-moisture tercile (left) and by rainfall duration (right). Dots are medians, bars 95 % intervals. This is a model diagnostic, not measured catchment runoff.
It lasts
The whole soil profile is wetted, not just its top few centimetres. That is the difference between rainfall that lasts into next week and rainfall that has dried out by the following day.
To be precise: this does not mean that all the water stays in the landscape. Some evaporates, some is used by vegetation, some drains deeper or later leaves through subsurface flow. The defensible statement is simpler — slower delivery gives the landscape more time to take up the same water.
How Rare
Was such rain really a rarity?
In the context of this summer, clearly yes. In July and August 2026 most of the water fell at high instantaneous intensity (53.8 and 60.2 % at rates of at least 10 mm/h); during the September episode it was one seventh of that. As a description of this particular summer, the claim holds.
But when we asked the long records whether steady rain is disappearing from the climatology, the answer was no. The share of precipitation from episodes lasting at least three days has no significant trend in spring or summer and increases in winter. Nor does the mean dry spell lengthen significantly at the national scale (+0.4 % per decade, p = 0.72). The analysis refuted our own starting hypothesis — which is precisely what data are for.
What is changing is subtler and matters more. Wet-day intensity rises significantly in spring, summer and autumn (+1.9, +2.1 and +2.4 % per decade) and not only in the warm half of the year — in the cold half as well (+2.1 % per decade, p = 0.018). At the same time the composition of summer rainfall shifts: water from low-intensity days (1–5 mm) declines by 3.4 % per decade and from 5–10 mm days by 2.5 %, while the share from days of at least 20 mm grows by 3.5 % per decade. Over six decades the high-intensity share of summer rainfall rose from roughly 25 % to about 35 %.
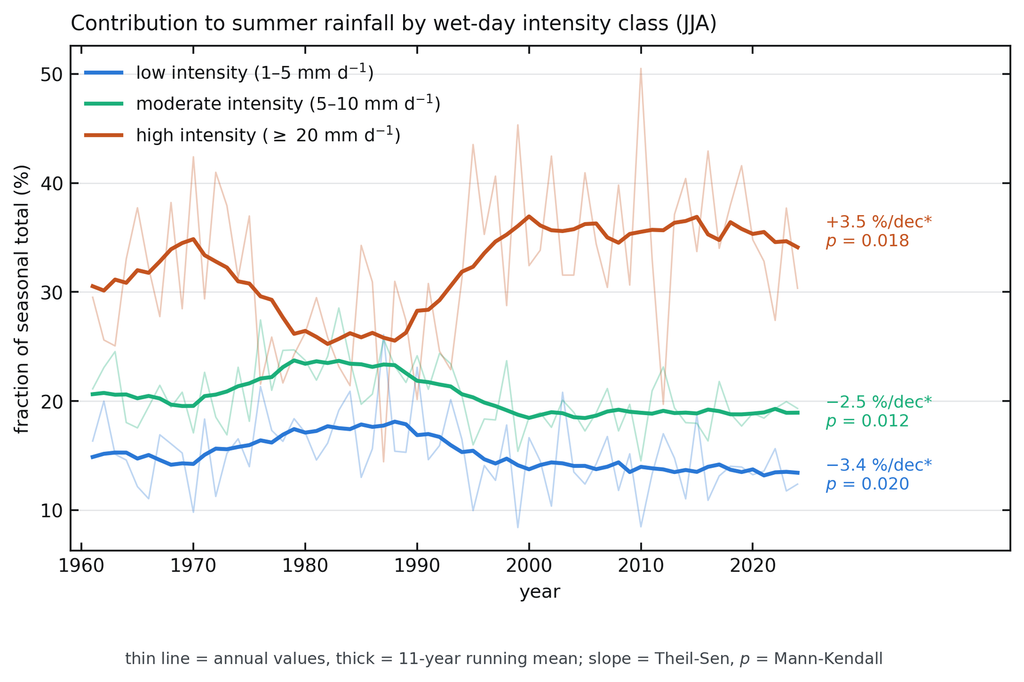
Figure 6 — Share of summer precipitation by wet-day intensity class, 54 long-record stations, 1961–2024. Water from low-intensity days is declining, from high-intensity days increasing. The 10–20 mm class is not plotted, so the curves do not sum to 100 %.
That this is not only a summer matter shows best when the same characteristics are computed by period of the year. The intensification is significant in every period except winter, while the lengthening of the mean dry spell is significant in none of them. That is exactly the difference between what the data carry and what would have suited us.
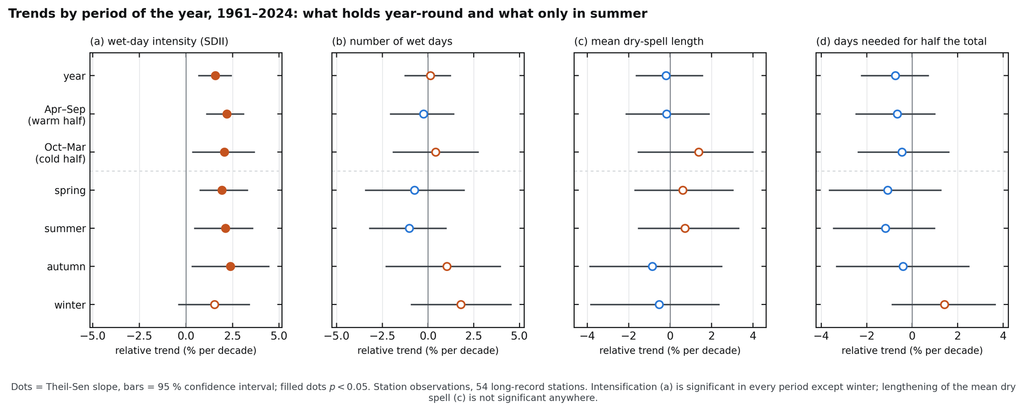
Figure 7 — Trends of four characteristics by period of the year, 54 stations, 1961–2024. Dots are Theil–Sen slopes, bars 95 % confidence intervals, filled dots mean p < 0.05. Panel (a) wet-day intensity, (b) number of wet days, (c) mean dry-spell length, (d) days needed for half the annual total.
Nor is it a matter of a handful of stations. Across the dense rain-gauge network — 538 stations, warm half-year, missing years filled from bias-corrected ERA5-Land — wet-day intensity rises at every station. At 404 of them the increase is statistically significant, and at none is there a significant decrease. (Neighbouring stations are of course correlated, so such counts should be read as a measure of spatial coherence rather than as independent tests.)
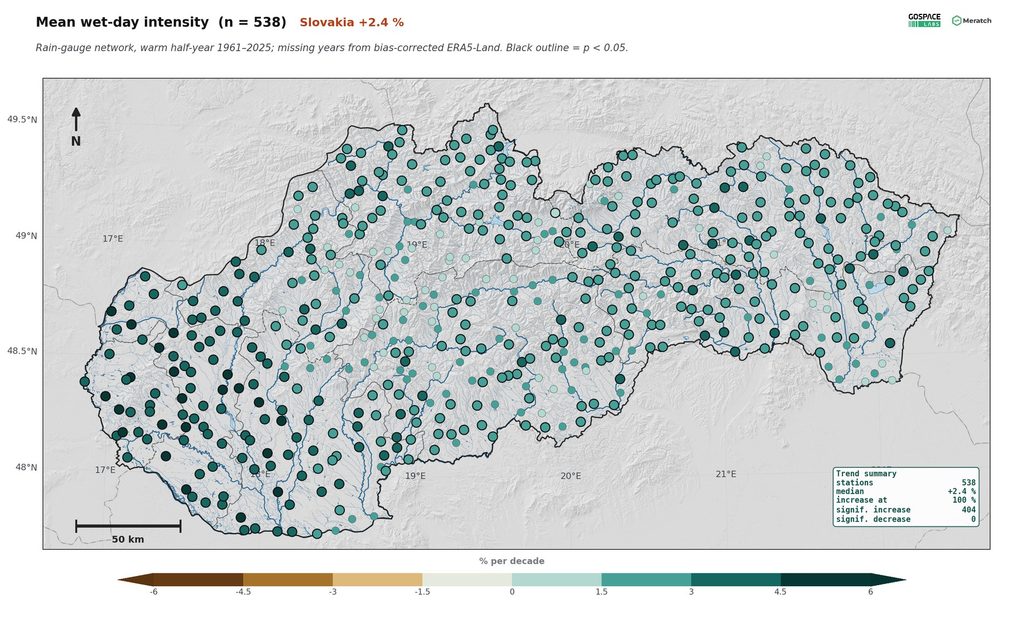
Figure 8 — Trend of mean wet-day intensity in the warm half-year (April–September) 1961–2025 at 538 rain gauges. A black outline marks a trend significant at p < 0.05. The scale is the same in all maps: −6 to +6 % per decade.
In one sentence: it is not true that steady rain is dying out. What is true is that the same amount of water increasingly arrives in harder doses — and that days like that September one are becoming a smaller part of the summer balance.
Why
Why it is happening
The basic reason is physical: warmer air holds more water vapour. It is not a simple rule by which every storm gains the same percentage — dynamics, circulation, humidity and the type of precipitation all matter. In the station data it appears as a shift of the whole relationship: at every daily temperature above roughly 9 °C, today’s extreme daily total is higher than it was in 1961–1990.
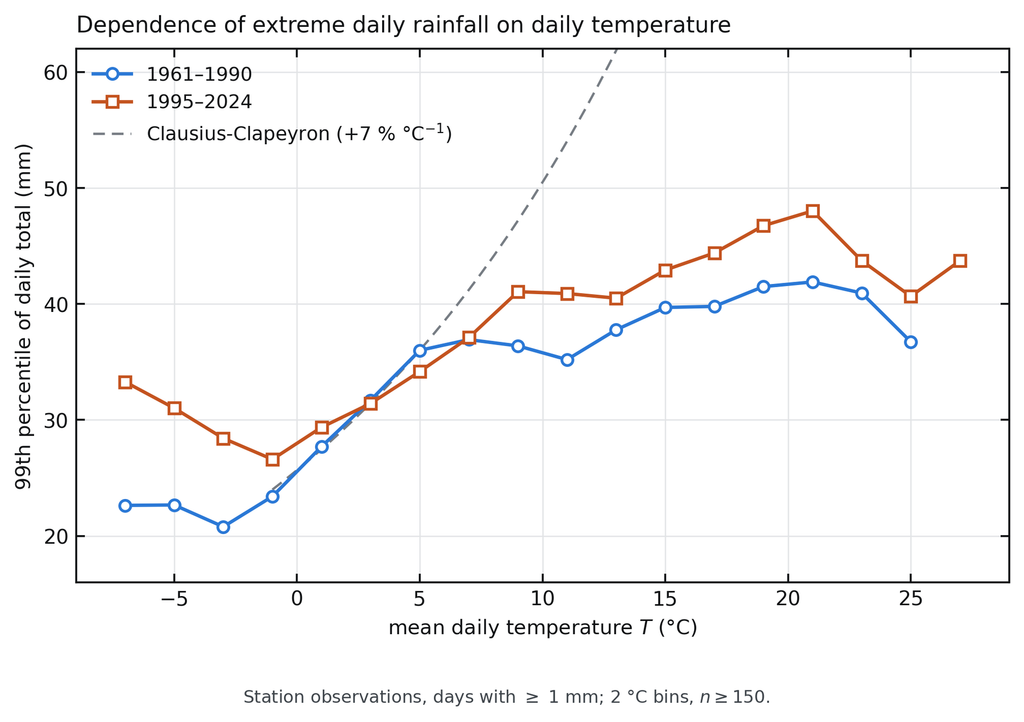
Figure 9 — Extreme daily rainfall against daily temperature in two periods. The curve has not merely risen at the hot end — it sits higher across the whole warm range.
The second question is whether this is simply a change in weather situations. It is not. When the change is split into two parts — how much came from a change in the frequency of circulation types and how much from changed rainfall within those same types — the frequency change alone would in fact have reduced warm-season precipitation. The intensification came from inside the individual situations.
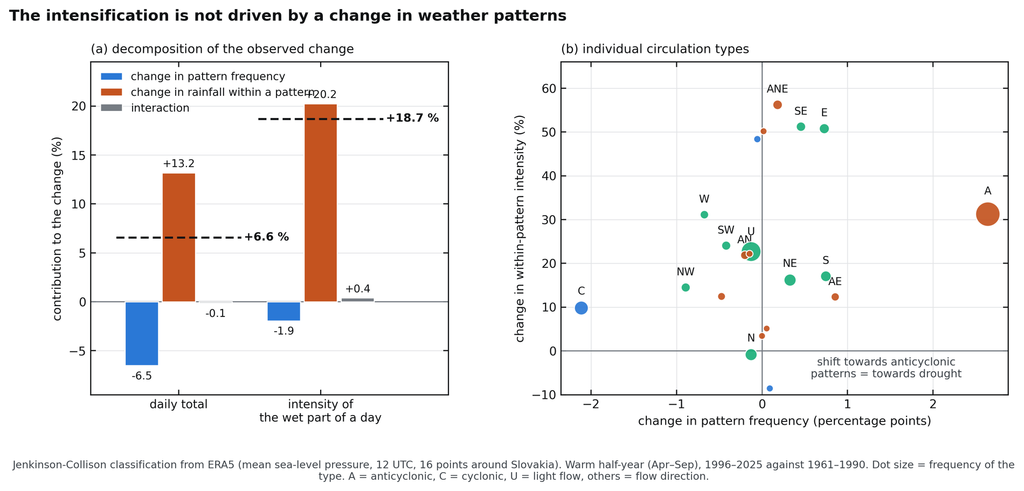
Figure 10 — Decomposition of the observed warm-season change (1996–2025 against 1961–1990) into a circulation-frequency contribution and a within-type contribution (Jenkinson–Collison classification from ERA5). Individual circulation types on the right.
This does not hand us a single cause in black and white — humidity, temperature or the position of pressure systems can also change inside one circulation type. But it does rule out the commonest objection, that “the weather has simply changed”.
The Outlook
What this means for the years ahead
Climate projections sharpen the same contrast. Across an ensemble of eleven CMIP6 models, the late-century median for Slovakia under high emissions is about 10 % fewer wet days, but 12 % higher wet-day intensity, a 20 % higher maximum one-day total and a 21 % longer maximum dry spell — with the annual total changing by only about 2 %. The yearly figure stays almost the same; its distribution in time does not.
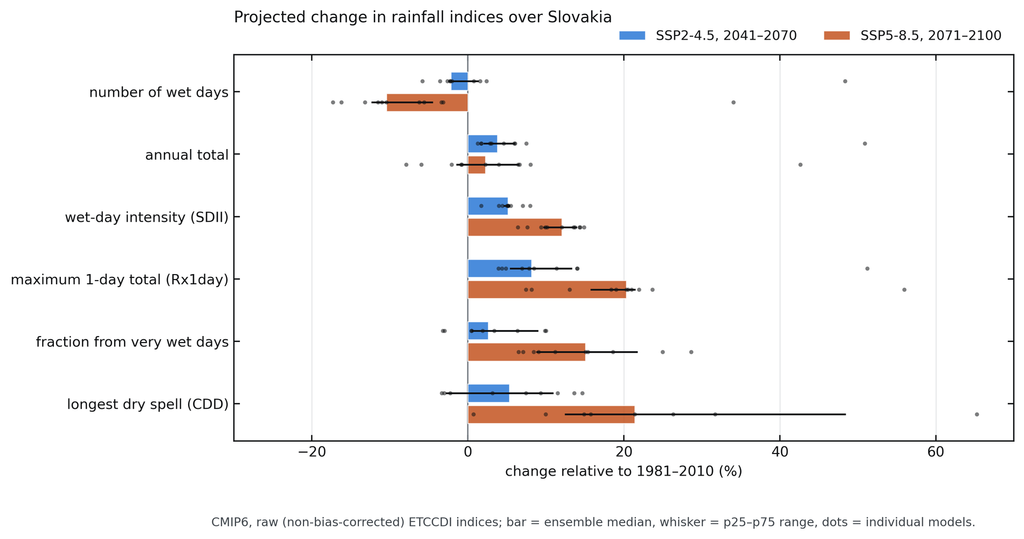
Figure 11 — Projected change of precipitation indices over Slovakia, 11 CMIP6 models. Wet days become fewer while intensity, the maximum one-day total and the dry spell all increase; the annual total changes least.
Across Europe the same picture is even clearer in the warm half-year: dry spells lengthen over 70 % of land and wet days become fewer over 83 % of it, while in the cold half-year the signal is several times weaker. Slovakia lies in the transition belt between a wetting north and a drying Mediterranean, which is why the signal here is weakest and most variable.
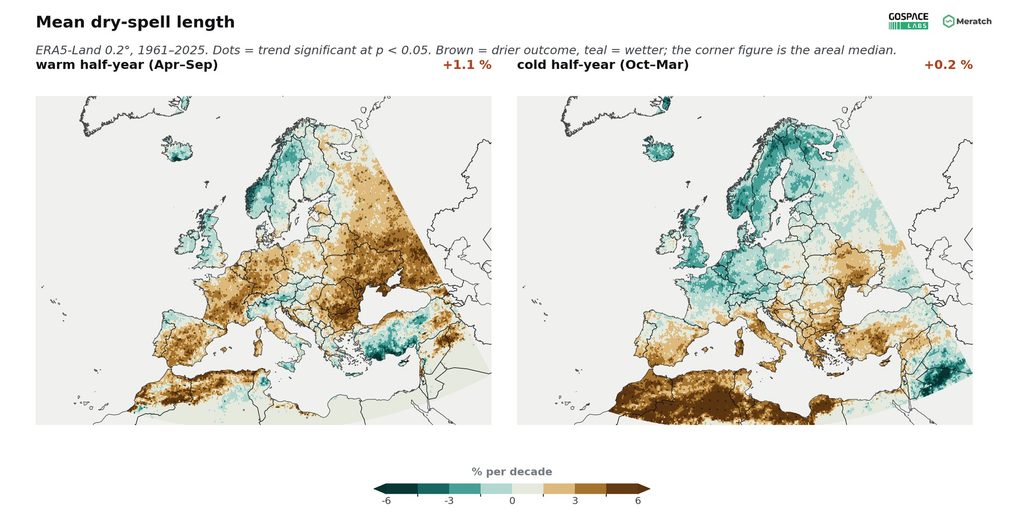
Figure 12 — Trend of mean dry-spell length over Europe, 1961–2025 (ERA5-Land). Warm half-year (April–September) on the left, cold half-year (October–March) on the right. Brown means longer dry spells, teal shorter ones; dots mark a significant trend and the corner figure is the areal median.
In practice this is an uncomfortable combination: in the warm half of the year, when evaporation is highest and water most needed, there will be fewer opportunities for rain like that of 11 September and more water in each individual event — which is exactly the form that infiltrates worst.
What Can Be Done
Where we can help
The first step is knowing the state of the landscape — not once a season but continuously. We monitor soil water from a combination of measurements, radar and models, so it is visible not only how much rain fell but how much of it actually stayed in the soil.
The second step is time. Short-range precipitation forecasting (nowcasting) tells you whether the rain coming is convective or steady; the seasonal outlook shows whether it makes sense to count on the stored water for the weeks ahead. With that comes early warning — in both directions: for drought, and for intense rainfall and flash floods.
The third step is data for planning. Where to retain water, which return period to design for, how that will change by 2050 and 2100 — these can be answered quantitatively rather than by guesswork.
If you work with soil water, water retention or flash-flood risk in your area, get in touch — we will show you what data you can have at hand.
Sources and further reading
The analysis rests on long station records, one-minute observations, the ERA5-Land reanalysis and a CMIP6 model ensemble. The works below are the source of the methods used, or an independent comparison for the conclusions in the text.
[1] Sinclair, S., Pegram, G. (2005): Combining radar and rain gauge rainfall estimates using conditional merging. Atmospheric Science Letters 6, 19–22. — the radar–gauge merging method behind Figure 2.
[2] Muñoz-Sabater, J. et al. (2021): ERA5-Land: a state-of-the-art global reanalysis dataset for land applications. Earth System Science Data 13, 4349–4383. — source of the episode balance (Figures 4 and 5) and of the European maps.
[3] Lavers, D. A. et al. (2022): An evaluation of ERA5 precipitation for climate monitoring. Quarterly Journal of the Royal Meteorological Society 148, 3152–3165. — why the reanalysis is used to compare categories rather than for absolute intensities.
[4] Duration and intensity of rainfall events with the same erosivity change sediment yield and runoff rates (2020). International Soil and Water Conservation Research. — experimental confirmation that intensity and duration change runoff at comparable erosive forcing.
[5] Zolina, O. et al. (2010): Changing structure of European precipitation: longer wet periods leading to more abundant rainfalls. Geophysical Research Letters 37, L06704. — an earlier European analysis of wet-spell length; a different period and season from ours, hence a different spatial picture.
[6] Observed extreme precipitation trends and scaling in Central Europe (2019). Weather and Climate Extremes. — independent confirmation of intensifying precipitation extremes in Central Europe.
[7] Super-Clausius–Clapeyron scaling of extreme precipitation explained by shift from stratiform to convective rain type (2025). Nature Geoscience. — why the type of rain matters at short durations.
[8] Jones, P. D., Hulme, M., Briffa, K. R. (1993): A comparison of Lamb circulation types with an objective classification scheme. International Journal of Climatology 13, 655–663. — the objective circulation classification used for Figure 10.
[9] Rutkowska, A. et al. (2025): Changes in precipitation patterns in Poland derived from projected downscaled future climate data from CMIP5 and CMIP6. International Journal of Climatology. — a comparable projection for neighbouring Poland.

